What is a Profiler & Why is it Useful? 🕵️♂️
A profiler is a tool that analyzes your running program to understand its resource usage (CPU, memory, I/O) and execution flow. It’s like an X-ray vision for your code.
Key Benefits:
- Pinpoint Performance Bottlenecks: Instantly identify slow functions, inefficient code, or costly database queries. No more guessing!
- Optimize Resources & Save Costs: By finding bottlenecks, you can make your code more efficient, meaning your microservices need less CPU or memory. This directly translates to lower cloud bills for your Kubernetes clusters.
- Deep Code Understanding: See how your application truly behaves under live production load, revealing hidden inefficiencies or unexpected interactions.
Why Google Cloud Profiler? ☁️📊
Google Cloud Profiler is a continuous profiling solution built for production environments.
- Always-On Insight: It constantly collects performance data from your running microservices (even across many Kubernetes pods), giving you a real-time, aggregated view of their health.
- Low Overhead: Designed to run in production with minimal impact on your application’s performance (typically <0.5% CPU increase for Java).
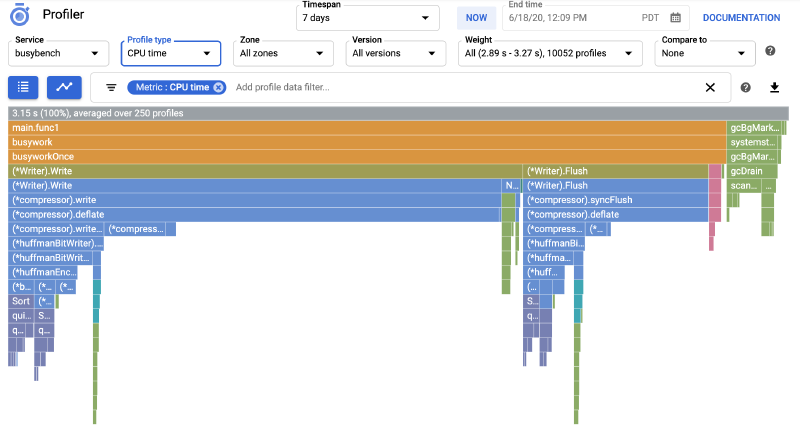
- Rich Data & Visuals: Provides detailed profiles (CPU, Memory, I/O, Contention) visualized as interactive “flame graphs,” making it easy to spot where resources are being consumed.
- Seamless Cloud Integration: Naturally integrates with your Google Cloud environment, making deployment and data analysis straightforward for your GKE-hosted services.
Why Not to Use (Considerations): 🤔
While powerful, it’s good to keep these in mind:
- Focus on Performance: It excels at performance analysis, not debugging logical errors or functional bugs.
- Complementary Tool: It works best when combined with other observability tools like traditional logging, monitoring (e.g., Cloud Monitoring), and distributed tracing (e.g., Cloud Trace) for a full picture of your application’s health.
Implementation
How I Implemented Google Cloud Profiler in Our Java Microservices (Kubernetes & Helm)
Step 1: Building the Profiler Agent into the Docker Image 🐳
First, the Google Cloud Profiler Java agent needs to be present within our microservice’s Docker image. We achieved this by adding the following steps to our Dockerfile:
| |
Step 2: Templating JAVA_TOOL_OPTIONS with Helm ⚙️
The Google Cloud Profiler agent is activated via the JAVA_TOOL_OPTIONS environment variable. To manage this dynamically for our Kubernetes deployments, we leveraged Helm’s templating capabilities:
| |
Step 3: Injecting JAVA_TOOL_OPTIONS into Kubernetes Deployment 🚀
With the Helm template ready, we then instruct our Kubernetes Deployment to use it as an environment variable for our Java container:
| |
Step 4: Configuring Parameters in values.yaml 🛠️
Finally, we define the actual parameters and toggles in our values.yaml:
| |
Conclusion
With this setup, we gained:
- Flexibility: Easily enable or disable profiling and JMX.
- Environment-Specific Configuration: Different behaviors for prod vs. dev.
- Version Tracking: Profiles linked to specific service versions.
- Centralized Control: All profiling configurations managed within Helm charts.
This approach allows us to continuously monitor and optimize the performance of our Java microservices across all Kubernetes environments.
| |