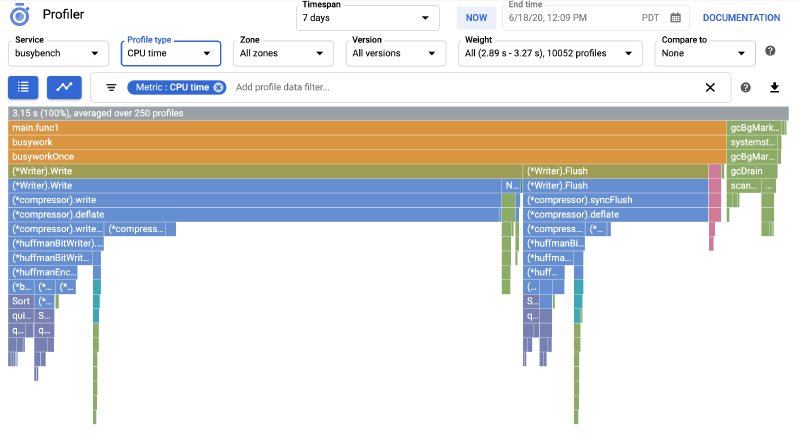
🔍 What is Cloud Profiler?
Google Cloud Profiler is a continuous profiling tool that helps analyze CPU and memory usage in production environments with minimal overhead. It provides insights into performance bottlenecks, enabling teams to optimize their applications for efficiency and cost savings.
🛠 What I Did
1️⃣ Configuring Helm Charts
- Rendered the necessary Helm templates:
_helpers.tpldeployment.yamlorcronjob.yaml
- Added profiling and JMX parameters to
values.yamlfor prod and dev environments.
2️⃣ Profiling Parameters Added
JMX Parameters:
1
2
3
4
5
6
7
- **JMX Parameters**: - jmxParameters: "-Dcom.sun.management.jmxremote.rmi.port=9996 -Dcom.sun.management.jmxremote.port=9996 -Dcom.sun.management.jmxremote=true -Dcom.sun.management.jmxremote.authenticate=false -Dcom.sun.management.jmxremote.ssl=false -Djava.rmi.server.hostname=[IP_ADDRESS]"Enables JMX Remote (-Dcom.sun.management.jmxremote=true)
Sets the JMX Port (-Dcom.sun.management.jmxremote.port=9996)
Disables authentication & SSL for easy local monitoring
Defines the RMI server hostname (127.0.0.1) for local access
JVM Profiling Parameters:
These parameters enable Cloud Profiler and configure heap sampling, service versioning, and project ID:
| |
- Loads the Profiler Agent (-agentpath:/opt/cprof/profiler_java_agent.so)
- Enables Heap Sampling (-cprof_enable_heap_sampling=true) for memory usage analysis
- Defines Service Version & Project ID to organize profiling data in GCP
3️⃣ Updating the Dockerfile 🐳
To ensure the Cloud Profiler agent is available in the image, I modified the Dockerfile to download and install the profiler agent:
| |
Installs required dependencies (tar, curl, gzip)
Creates a directory for the profiler agent (/opt/cprof)
Downloads & extracts the profiler agent from Google Cloud Storage
Ensures proper permissions with COPY –chown and –chmod
Note: This is not the entire Dockerfile—there are additional configurations as well.
4️⃣ Deployment & Testing
- Set up port forwarding and used VisualVM to create a JMX connection for real-time monitoring of metrics.
- Deployed the changes to a dev environment and verified that the workload appeared in GCP Profiler.
🚀 Key Learnings & Benefits for DevOps**
✅ Enhanced Performance Monitoring**
Cloud Profiler provides deep visibility into CPU and memory usage with minimal impact on production performance.
🛑 Proactive Bottleneck Detection By continuously profiling workloads, we can identify inefficient code paths and optimize resource consumption.
💰 Scalability & Cost Optimization Analyzing production workload performance enables better resource allocation, reducing unnecessary compute costs.
🔧 Improved Debugging & Troubleshooting With JMX connections and VisualVM, the team can analyze metrics in real time for quicker issue resolution.
🎉 Final Thoughts
This was a fun and valuable project! It not only improved observability but also strengthened performance tuning and cost efficiency in our Kubernetes workloads. 🚀